
ROAS Is Not Enough: What Should Businesses Measure in Google Ads?
Every Google Ads dashboard has a favourite number. For most businesses, it’s ROAS — Return on Ad Spend. It’s clean, it’s easy to calculate, and it makes reporting simple. Spend ₹50,000, generate ₹2,00,000 in attributed revenue, and you have a 4x ROAS. The slide looks great in the boardroom.
But here’s the uncomfortable truth that experienced marketers learn the hard way: a 4x ROAS can lose money. A 2x ROAS can be the most profitable campaign in the account. The difference is everything ROAS leaves out — margins, repeat purchases, lead quality, customer lifetime value, and the difference between revenue and actual profit.
This guide is for every business that runs Google Ads — e-commerce stores, lead-generation services, SaaS companies, local businesses, startups, and the marketing managers and PPC specialists who run their campaigns. You’ll learn why ROAS is a useful diagnostic metric but a dangerous sole benchmark, which metrics to track instead, and how to build a measurement framework that connects clicks to profit.

What Is ROAS in Google Ads?
ROAS (Return on Ad Spend) measures the revenue generated for every unit of currency spent on advertising. The formula is simple:
ROAS = Attributed Revenue ÷ Advertising Spend
If you spend ₹50,000 and generate ₹2,00,000 in attributed revenue, your ROAS is 4 (often written as 4x or 400%). This means the campaign generated ₹4 in attributed revenue for every ₹1 spent.
Google Ads reports ROAS in the Campaigns tab when you have conversion values set up. It’s used both as a reporting metric and as a bid strategy target (Target ROAS) in automated bidding.
Why ROAS Became a Popular Google Ads Metric
ROAS gained popularity because it answers a question that every business asks: “Is our advertising working?” It’s platform-native, meaning Google Ads calculates it automatically. It works seamlessly with automated bidding. It’s easy to compare across campaigns, channels, and time periods. And critically, it gives a single, comprehensible number that non-marketing stakeholders can understand.
There’s nothing wrong with using ROAS. The problem is when it becomes the only metric that matters.
Why ROAS Alone Does Not Tell the Full Story
ROAS answers one question: How much revenue did we generate relative to advertising spend? That’s valuable. But businesses need answers to harder questions:
- Are we acquiring profitable customers?
- Are leads actually qualified?
- How much does each customer truly cost to acquire?
- What is the customer’s lifetime value?
- Are conversions turning into real sales?
- Are campaigns creating incremental business?
- Is growth sustainable?
- Are we measuring the right conversion actions?
- Is the attribution model giving a realistic picture?
ROAS cannot answer any of these. Worse, optimizing exclusively for ROAS can actively harm the business by favouring cheap retargeting clicks over expensive new-customer acquisition, or by rewarding low-margin products because the algorithm only sees revenue, not margin.
ROAS vs ROI: What's the Difference?
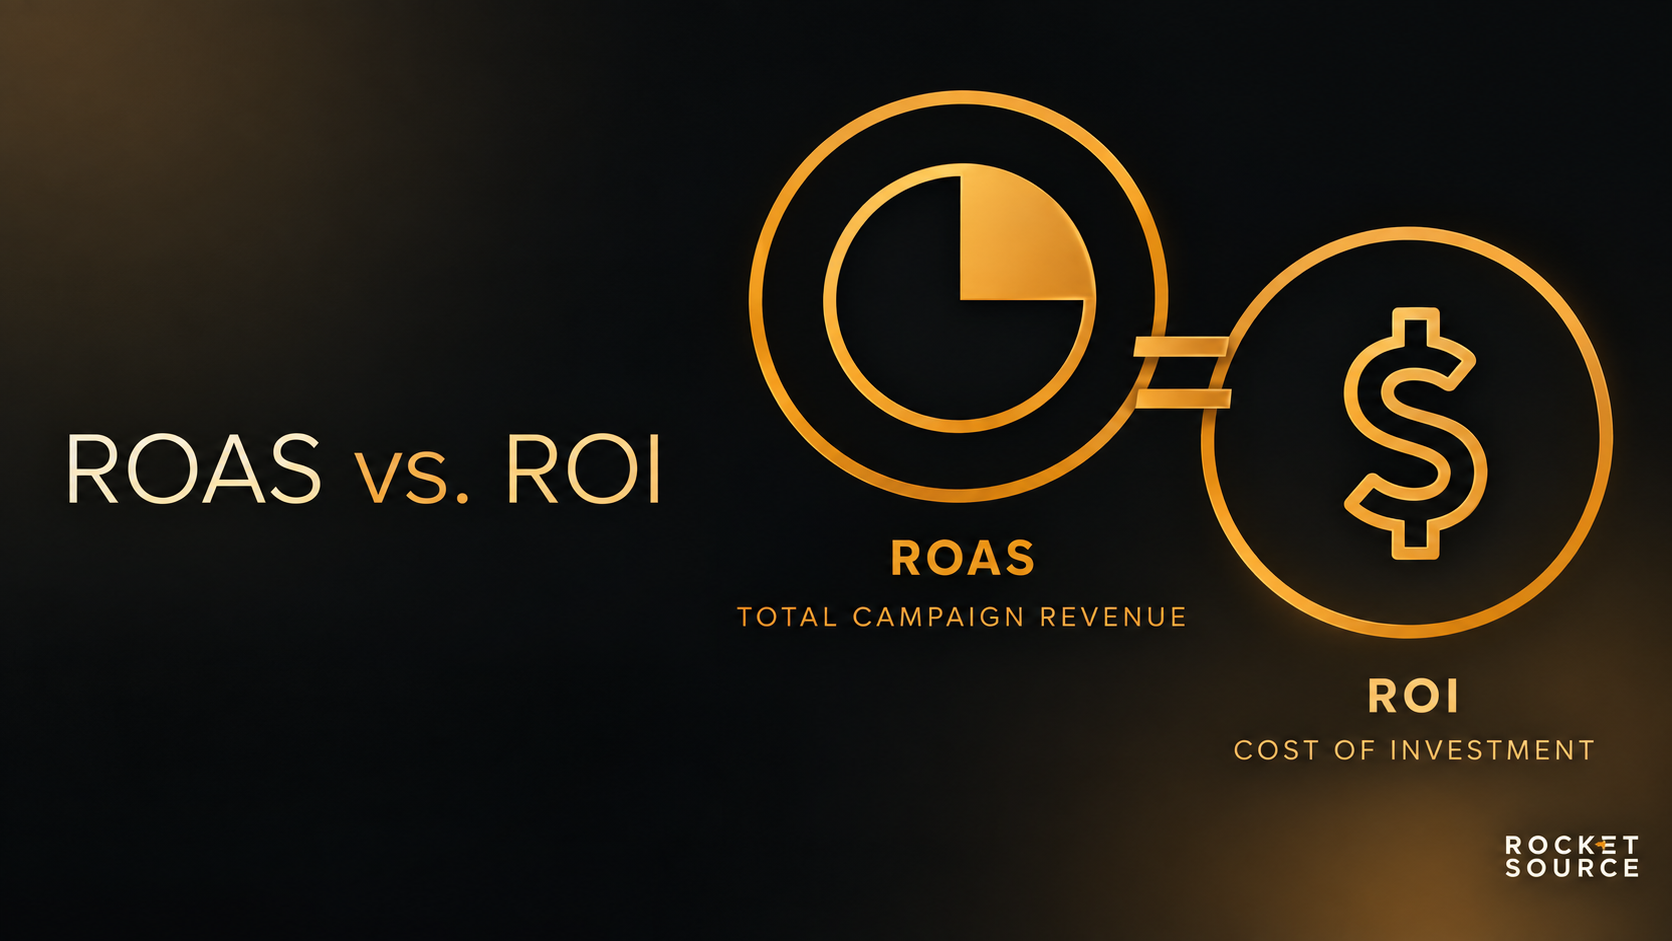
ROAS and ROI are often used interchangeably. They are not the same thing.
ROAS measures attributed revenue ÷ ad spend. It’s a top-line efficiency metric.
ROI measures (profit − cost) ÷ cost. It accounts for all costs — COGS, fulfillment, overhead, salaries, agency fees — and expresses the net return.
A campaign can have a 5x ROAS and a negative ROI. That happens when the revenue generated doesn’t cover the full cost of delivering the product or service. ROAS is a useful advertising metric. ROI is a business metric. Both matter, but ROI is the one that determines whether the business actually makes money.
12 Metrics Businesses Should Measure Alongside ROAS
These metrics — grouped by financial, performance, lead generation, and e-commerce categories — give a fuller picture of Google Ads performance.
1. Customer Acquisition Cost (CAC)
CAC measures the total cost to acquire one paying customer: total ad spend ÷ number of new customers acquired. Unlike cost per conversion (which may count form fills or add-to-carts), CAC counts actual customers. Google Ads supports a New Customer Acquisition goal at the campaign level, which lets you set a dedicated budget for acquiring first-time customers and reports new customer acquisition cost alongside standard metrics.
2. Customer Lifetime Value (LTV / CLV)
LTV estimates the total revenue (or profit) a customer generates over their entire relationship with the business. Google Ads’ API includes a new_customer_lifetime_value metric that estimates the long-term value of customers making their first purchase through ads.
The ratio LTV:CAC is one of the most important health indicators in any business. A general guideline is 3:1 — meaning a customer should generate three times their acquisition cost over their lifetime.
3. Conversion Rate
Conversion rate is the percentage of users who complete a desired action (purchase, form fill, call, sign-up) after clicking an ad. It shows how effectively you turn clicks into actions. A high conversion rate with low-value conversions, however, can be misleading — which is why conversion quality matters as much as conversion volume.
4. Cost Per Conversion
Cost per conversion (also called cost per action or CPA) is ad spend ÷ conversions. It tells you how much each conversion costs. The limitation: not all conversions are equal. A ₹200 cost per email sign-up is very different from a ₹200 cost per completed purchase. Always pair cost per conversion with the value of that conversion.
5. Cost Per Qualified Lead
Cost per qualified lead is ad spend ÷ number of leads that meet your qualification criteria. This is a far more meaningful metric than cost per lead because it filters out leads that will never convert. To measure it, you need CRM integration — connecting Google Ads to your CRM so the platform knows which leads became qualified, which became customers, and which went nowhere.
6. Lead-to-Customer Rate
The percentage of leads that become paying customers. If a campaign generates 100 leads but only 5 become customers, the lead-to-customer rate is 5%. This metric, combined with cost per lead, gives you true customer acquisition cost: cost per lead ÷ lead-to-customer rate = CAC.
7. Average Order Value (AOV)
Average order value is total revenue ÷ number of orders. AOV helps you understand order economics. Two campaigns can have the same ROAS but very different AOVs, which affects profitability because fulfillment and transaction costs are spread across fewer or more orders.
8. Profit Margin
Profit margin is the percentage of revenue that remains after deducting the cost of goods sold (and sometimes operating costs). Margin is the bridge between revenue and profit. Without it, ROAS is just a revenue efficiency number. With it, you can calculate break-even ROAS: Break-even ROAS = 1 ÷ profit margin. A product with a 50% margin needs a 2x ROAS to break even. A product with a 10% margin needs a 10x ROAS.
9. Contribution Margin
Contribution margin is revenue minus variable costs (COGS, shipping, payment processing, etc.) — expressed as a total or per unit. It tells you how much each sale contributes to covering fixed costs and generating profit. When combined with ad spend, contribution margin reveals whether advertising is actually contributing to the bottom line.
10. Retention & Repeat Purchase Rate
Repeat purchase rate is the percentage of customers who buy again. Retention is the percentage of customers who remain active over time. Both directly affect LTV and therefore the acceptable CAC. A business with a 60% repeat rate can afford a much higher initial CAC than one with a 10% repeat rate — because the customer is worth more over time.
11. Incrementality & Attribution
Attribution tells you which touchpoints were associated with a conversion. Incrementality tells you what happened because the ads ran that would not have happened otherwise. Google has made data-driven attribution (DDA) the default model — it uses account data to distribute credit across the conversion path. But attribution alone cannot answer the incrementality question. Google’s Meridian GeoX tool allows geographic-based incrementality testing to measure causal impact.
12. Profit-Based ROAS (POAS)
POAS (Profit on Ad Spend) measures profit generated per unit of ad spend, rather than revenue. It requires feeding margin or profit data into the conversion signal so the algorithm optimizes for profit, not just revenue. Several advertisers have reported significant profit increases after switching from ROAS-based to POAS-based optimization.
Why a 4x ROAS Can Still Lose Money: A Simple Example
Let’s walk through a hypothetical example. A business spends ₹50,000 on Google Ads and generates ₹2,00,000 in attributed revenue.
ROAS = ₹2,00,000 ÷ ₹50,000 = 4.0x
Looks great. But now let’s look at the actual business economics (hypothetical numbers):
Revenue: ₹2,00,000
Cost of Goods/Services (55%): −₹1,10,000
Shipping & Fulfillment: −₹18,000
Payment Processing (2%): −₹4,000
Discounts & Refunds: −₹12,000
Ad Spend: −₹50,000
Agency/Software Fees: −₹8,000
Net Profit: −₹2,000
The campaign generated a 4x ROAS and lost ₹2,000. This is not a hypothetical anomaly — it’s common when margins are thin, refunds are high, and operational costs are significant. The break-even ROAS for this business (with a 45% contribution margin after COGS and fulfillment) would be approximately 1 ÷ 0.45 = 2.22x. So a 4x ROAS should be profitable — except the additional costs (discounts, agency fees, payment processing) pushed it into loss.
This is why ROAS alone is dangerous. It ignores everything between revenue and profit.
The Right Metrics Depend on Your Business Model
No single metric works equally well for every business. Here’s what to prioritise based on your model.
E-commerce
Track: Revenue, ROAS, contribution margin, AOV, CAC, repeat purchase rate, LTV, and new customer acquisition ratio. The key insight for e-commerce is distinguishing between first-purchase ROAS and blended ROAS. A campaign may have a low first-purchase ROAS but acquire customers who return repeatedly — making it far more valuable than a high-ROAS retargeting campaign that only reaches existing buyers.
Lead Generation
Track: Cost per lead, qualified lead rate, cost per qualified lead, lead-to-customer rate, CAC, revenue per customer, and offline conversion data. Connect your CRM to Google Ads so the platform can optimise toward leads that actually become customers. Google Ads now has a native Leads screen that categorises leads into raw, qualified, converted, and lost.
Local Businesses
Track: Calls, directions requests, form submissions, bookings, qualified enquiries, actual customers, and cost per customer. Google Ads reports local actions — calls, direction clicks, website visits — when your Business Profile is linked. The key metric is cost per actual customer, not cost per click or even cost per call.
SaaS & Subscription Businesses
Track: CAC, trial-to-paid conversion rate, LTV, retention, churn, CAC payback period, and recurring revenue. ROAS is widely considered the wrong primary metric for SaaS because subscription revenue accrues over months or years — not at the moment of first conversion. The right question is: how many months until this customer pays back their acquisition cost?
ROAS vs Other Metrics: A Comparison
| Metric | What It Measures | Why It Matters | Limitation |
|---|---|---|---|
| ROAS | Revenue relative to ad spend | Measures advertising revenue efficiency | Does not measure profit |
| CAC | Cost to acquire a customer | Connects advertising to customer acquisition | Requires accurate customer data |
| LTV | Customer value over time | Shows long-term customer economics | Can require assumptions |
| CPL | Cost per lead | Useful for lead generation | Does not measure lead quality |
| Cost Per Qualified Lead | Cost of acquiring qualified leads | Better reflects lead quality | Requires qualification tracking |
| Conversion Rate | Percentage of users who convert | Shows conversion efficiency | Conversion quality may vary |
| AOV | Average order value | Helps understand order economics | Does not show profitability |
| Profit Margin | Revenue remaining after costs | Connects advertising to profitability | Requires reliable cost data |
Why a High ROAS Can Still Be a Problem
These are measurement considerations, not universal conclusions. But they are common enough that every advertiser should understand them.
- High ROAS but low margins: A 6x ROAS on a product with a 10% margin may barely break even after fulfillment and returns.
- High ROAS from existing customers: Retargeting campaigns often show high ROAS because they reach people who were already going to buy. This doesn’t grow the business.
- High ROAS from branded searches: If someone searches your brand name and clicks your ad instead of the organic result, you’ve paid for a conversion that was already on its way.
- High ROAS but poor incremental growth: The revenue might have happened anyway. Without incrementality testing, you can’t know.
- High ROAS but low LTV: A campaign that acquires one-time buyers at a 5x ROAS may be less valuable than a campaign acquiring repeat customers at a 2x ROAS.
- High ROAS but poor-quality leads: In lead generation, a high conversion rate on form fills means nothing if those leads never become customers.
- High ROAS from incomplete tracking: If conversion tracking is missing, double-counted, or misconfigured, the ROAS number itself is unreliable.
- High ROAS during short-term promotions: A flash sale can temporarily inflate ROAS. But it may pull forward demand that would have occurred later at full price.
- High ROAS that does not scale: A small budget campaign can show excellent ROAS. Increasing spend often reduces efficiency — the next dollar is always harder than the last.
Can a Lower ROAS Campaign Still Create Business Value?
Yes — sometimes. A campaign with a lower immediate ROAS can be valuable when it contributes to business growth in ways ROAS doesn’t capture.
- New customer acquisition: Acquiring a first-time customer often costs more than re-engaging an existing one. The first-purchase ROAS may be lower, but the customer’s LTV makes it worthwhile.
- Longer sales cycles: In B2B or high-consideration purchases, the first click rarely converts immediately. Attribution models and offline conversion imports are essential here.
- Lead generation: A lead-generation campaign may show a low ROAS because the revenue happens offline and later — in the CRM, not on the website.
- Brand discovery: Upper-funnel campaigns (YouTube, Demand Gen) often have low direct ROAS but contribute to future branded searches and conversions.
- Subscription businesses: The first-month ROAS may be 1x, but if the customer stays for 12 months, the LTV-ROAS is 12x.
- Repeat-purchase products: A customer acquired at a 1.5x first-purchase ROAS who buys three more times is far more valuable than a one-time buyer at 3x.
The business value of a low-ROAS campaign depends entirely on the economics and the objective. It is not automatically good — but it is not automatically bad either.
The Metric Stack: Measure From Click to Customer to Profit
This is the core framework. Each stage answers a different business question. Analysing one metric in isolation is like reading one chapter of a book and claiming you know the story.
Stage 1 — Traffic
Metrics: Impressions, Clicks, CTR, CPC, Search Impression Share.
Question: Are we reaching the right people at the right cost?
Stage 2 — Conversion
Metrics: Conversion Rate, Cost Per Conversion, Conversion Value.
Question: Are users taking the desired action, and at what cost?
Stage 3 — Lead / Customer Quality
Metrics: Qualified Leads, Sales Opportunities, Customers Acquired, Lead-to-Customer Rate, Cost Per Qualified Lead.
Question: Are the conversions turning into actual business?
Stage 4 — Financial Performance
Metrics: CAC, Revenue, ROAS, Profit, Contribution Margin, POAS.
Question: Is the advertising generating profit, not just revenue?
Stage 5 — Long-Term Business Value
Metrics: LTV, Repeat Purchase Rate, Retention, Churn, Payback Period, Customer Profitability.
Question: Is growth sustainable, or are we buying revenue at a loss?
TRAFFIC → CONVERSION → QUALITY → CUSTOMER → REVENUE → PROFIT → LTV
Each stage answers a different business question. Connect them all — don’t analyse one in isolation.
Frequently Asked Questions
Is ROAS enough to measure Google Ads success?
No. ROAS measures revenue relative to ad spend, but it doesn’t account for profit, lead quality, customer lifetime value, or incrementality. It should be used alongside CAC, LTV, contribution margin, and qualified lead data.
What is a good ROAS?
There is no universal “good” ROAS. It depends entirely on your profit margin. A 2x ROAS can be highly profitable for a business with a 60% margin. A 6x ROAS can be unprofitable for a business with a 10% margin. The break-even ROAS is 1 ÷ profit margin.
What is the difference between ROAS and ROI?
ROAS measures revenue ÷ ad spend. ROI measures (profit − cost) ÷ cost. ROAS ignores costs other than advertising. ROI accounts for all costs. ROAS is an advertising metric. ROI is a business metric.
Why can a high ROAS still be unprofitable?
Because ROAS only measures revenue. If a product has thin margins, high returns, or expensive fulfillment, the revenue generated may not cover the total cost of delivering it. A 5x ROAS on a 10% margin product may lose money after all costs.
What is CAC in Google Ads?
CAC (Customer Acquisition Cost) is the total cost to acquire one paying customer: total ad spend ÷ number of new customers. Google Ads supports a New Customer Acquisition goal that reports new customer acquisition cost alongside standard metrics.
How does LTV affect Google Ads measurement?
LTV (Lifetime Value) estimates the total value a customer generates over their relationship with your business. It directly affects your acceptable CAC. If LTV is high, you can afford to spend more to acquire a customer. A healthy LTV:CAC ratio is generally 3:1 or higher.
What metrics should lead-generation businesses track?
Cost per lead, qualified lead rate, cost per qualified lead, lead-to-customer rate, CAC, revenue per customer, and offline conversion data. Connect your CRM to Google Ads to optimise toward leads that become customers.
What metrics should e-commerce businesses track?
Revenue, ROAS, contribution margin, AOV, CAC, repeat purchase rate, LTV, and new customer acquisition ratio. Distinguish between first-purchase ROAS and blended ROAS.
Should businesses focus on conversions or revenue?
Both — but neither is sufficient alone. Focus on conversion quality and business value. A conversion that becomes a customer is worth far more than a cheap conversion that doesn’t.
How can businesses measure lead quality?
Connect your CRM to Google Ads using offline conversion imports or enhanced conversions for leads. Define what a qualified lead means for your business, then push that data back to Google Ads so the algorithm can optimise for quality, not just volume.
What is the difference between CPL and CAC?
CPL (Cost Per Lead) is ad spend ÷ number of leads. CAC (Customer Acquisition Cost) is ad spend ÷ number of customers. CPL measures lead generation cost. CAC measures customer acquisition cost. A low CPL with a low lead-to-customer rate can result in a high CAC.
How important is conversion tracking?
Conversion tracking is the foundation of Google Ads measurement. Without accurate conversion tracking, you’re optimising blind. Enhanced conversions — now a single on/off toggle as of 2026 — improve accuracy by sending hashed first-party data to Google.
How can offline conversions improve Google Ads measurement?
Offline conversions allow you to import data from your CRM — such as when a lead becomes a customer — back into Google Ads. This gives the algorithm visibility into what happens after the initial conversion, enabling optimisation toward real customers. Note: as of June 2026, offline conversion imports are migrating to the Data Manager API.
What is incrementality in advertising?
Incrementality measures the causal impact of advertising — what happened because the ads ran that would not have happened otherwise. Attribution tells you what got credit. Incrementality tells you what actually changed. Google’s Meridian GeoX tool enables geographic-based incrementality testing.
How often should businesses review Google Ads performance?
Review top-line metrics (spend, ROAS, conversions) weekly. Review business metrics (CAC, LTV, profit, lead quality) monthly. Review strategic metrics (incrementality, market trends, competitive positioning) quarterly.
Final Takeaway
ROAS is a useful diagnostic metric. It should remain part of your measurement stack. But it should not be the sole definition of success.
The businesses that get the most from Google Ads are the ones that connect advertising data to business data — CRM records, sales outcomes, profit margins, lifetime value, and retention. They measure from click to customer to profit, not just from click to conversion.
Start with the Metric Stack. Connect your CRM. Feed margin data into conversion values. Run incrementality tests when the budget allows. And remember: the goal is not to maximise ROAS. The goal is to build a sustainable, profitable business — and Google Ads is one channel that helps you do it.
Ready to Measure Beyond ROAS?
If your Google Ads reporting starts and ends with ROAS, you’re missing the metrics that actually drive business decisions. Talk to our team about building a measurement framework that connects advertising to profit.