
How to Know If Your Google Ads Campaign Is Actually Profitable
Revenue and ROAS alone don’t prove profitability. Here’s how to calculate what your Google Ads campaigns are actually earning after every cost.
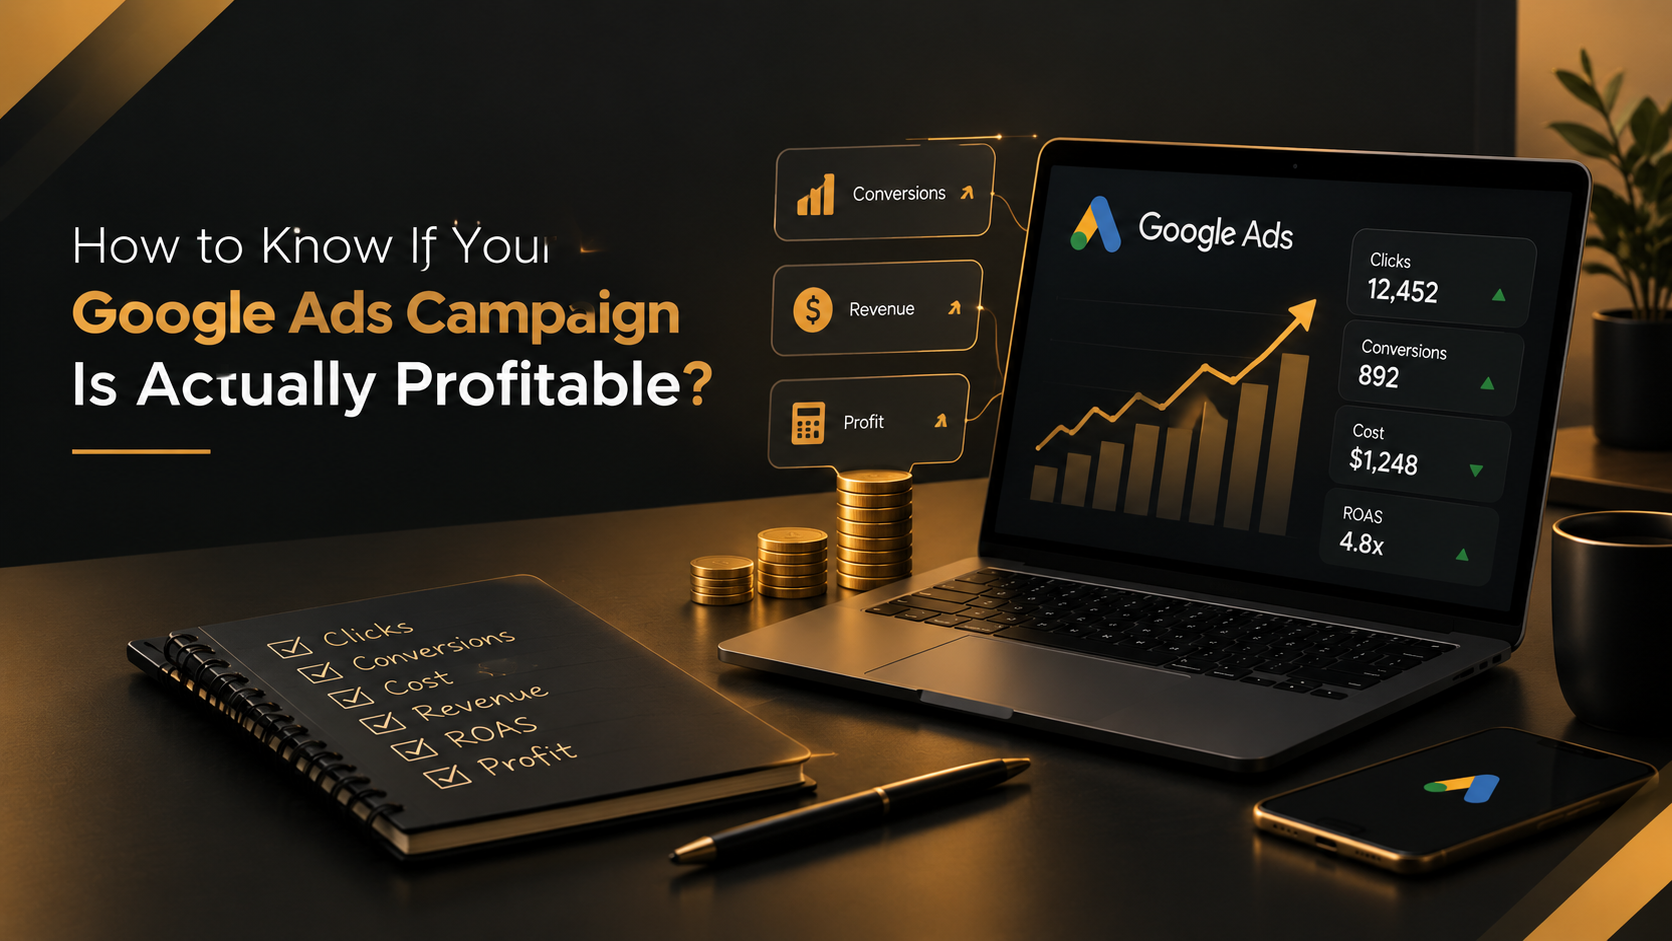
A business owner logs into Google Ads, sees ₹300,000 in tracked revenue against ₹100,000 in ad spend, and concludes the campaign is a winner. Three months later, the accountant asks why cash flow is tight.
This scenario plays out constantly. Revenue is visible. Profit is buried under product costs, shipping, refunds, payment processing, and the uncomfortable reality that not every customer who clicks actually converts into a paying one.
Google Ads can generate impressive top-line numbers while quietly eroding your margins. The platform’s reporting tools are built to show you what happened — not necessarily what it cost you to make it happen. That distinction is the entire ballgame when you’re trying to decide whether to scale, optimize, or pull the plug.
This guide walks through the exact calculations, metrics, and frameworks you need to answer one question honestly: Is my Google Ads campaign actually making money?
What Does It Actually Mean for a Google Ads Campaign to Be Profitable?
A Google Ads campaign is profitable when the contribution margin generated by the customers it acquires exceeds the total cost of acquiring them. That’s the plain-English definition. Everything else is detail.
The problem is that most advertisers stop at revenue. Revenue is the number at the top of the funnel. Profit is what survives after everyone else gets paid. Here’s how the layers break down:
| Layer | What It Includes | Why It Matters |
|---|---|---|
| Revenue | Total sales value attributed to ads | Shows demand, not viability |
| Gross Profit | Revenue minus cost of goods sold (COGS) | Reveals whether the product itself makes money before ad costs |
| Contribution Profit | Gross profit minus ad spend, shipping, fees, refunds | The number that tells you if the campaign is sustainable |
| Net Profit | Contribution profit minus operating overhead | The bottom line the business actually keeps |
Consider a simple example. An online store sells a product for ₹2,000. The cost to produce and ship it is ₹1,200. That’s a ₹800 gross profit per unit — a 40% gross margin. If the store spends ₹1,000 in Google Ads to acquire a customer who buys one unit, the campaign lost ₹200 on that first transaction. The revenue was ₹2,000. The profit was negative.
That’s the gap this article exists to close. Profitability is not a dashboard metric. It’s a business calculation. And it starts with understanding why ROAS — the metric most advertisers live by — doesn’t tell you what you think it tells you.
The Numbers You Need Before Judging Profitability
Not every business needs every metric. An e-commerce store selling ₹500 products has a different calculation than a B2B software company selling ₹500,000 annual contracts. But before you can calculate profitability, you need to know these numbers:
| Metric | Formula / Meaning | Why It Matters |
|---|---|---|
| Total Ad Spend | Sum of all Google Ads costs | The starting point for every calculation |
| Conversion Value | Total revenue attributed to ads | Tells you what the campaign generated, not what it kept |
| Number of Conversions | Total actions counted as conversions | Needed to calculate CPA and understand volume |
| Average Order Value (AOV) | Revenue ÷ Number of Orders | Shows the average transaction size |
| Gross Margin | (Revenue − COGS) ÷ Revenue | The single most important number for profitability |
| CPA | Ad Spend ÷ Conversions | What you paid per acquired action |
| CAC | Total Acquisition Cost ÷ New Customers | What you paid per actual customer (not just lead) |
| Conversion Rate | Conversions ÷ Clicks | Efficiency of turning traffic into action |
| Customer Lifetime Value (LTV) | Average Revenue per Customer × Retention Period | Long-term economic value of a customer |
| Refund / Cancellation Rate | Refunded Orders ÷ Total Orders | Reduces effective revenue and margin |
| Repeat Purchase Rate | Returning Customers ÷ Total Customers | Impacts whether first-purchase CAC is recoverable |
The mistake most businesses make is trying to optimize everything at once. Start with gross margin and ad spend. Those two numbers alone will tell you whether you’re in the ballpark of profitability. Add CAC and refund rates next. LTV and repeat purchase rates matter for businesses with longer sales cycles or subscription models — they’re not urgent for a one-time purchase e-commerce store.

How to Calculate Google Ads Profitability
The core formula is straightforward:
Ad-Attributed Profit = Revenue − Product/Service Costs − Ad Spend
But this simple version misses refunds, fees, and other variable costs. A more complete calculation uses contribution margin:
Contribution Profit = (Revenue × Gross Margin) − Ad Spend − Other Variable Costs
Worked example: A business spends ₹100,000 on Google Ads. The campaign generates ₹300,000 in tracked revenue across 150 orders. The average order value is ₹2,000. The gross margin is 35%. Refunds account for 5% of orders. Shipping and payment processing cost ₹80 per order.
- Gross profit before ads: ₹300,000 × 35% = ₹105,000
- Refund impact (5% of ₹300,000): −₹15,000
- Fulfillment and fees (150 orders × ₹80): −₹12,000
- Ad spend: −₹100,000
- Contribution profit: ₹105,000 − ₹15,000 − ₹12,000 − ₹100,000 = −₹22,000
The campaign generated ₹300,000 in revenue — a 3× ROAS — and still lost ₹22,000. That’s the reality ROAS hides.
How to Calculate Break-Even ROAS
Break-even ROAS is the minimum return required to cover all relevant variable costs and advertising spend — the point at which the campaign neither makes nor loses money.
Break-Even ROAS = 1 ÷ Gross Profit Margin
This formula is simple, but its implications are not. With a 25% gross margin, the break-even ROAS is 4.0. With a 40% margin, it drops to 2.5. With a 20% margin, it climbs to 5.0. That means a campaign with a 3× ROAS is profitable for a business with a 40% margin but deeply unprofitable for one with a 25% margin.
| Gross Margin | Break-Even ROAS | 3× ROAS Verdict |
|---|---|---|
| 20% | 5.0 | Losing money |
| 25% | 4.0 | Losing money |
| 30% | 3.33 | Losing money |
| 40% | 2.5 | Profitable |
| 50% | 2.0 | Profitable |
Note that this formula ignores repeat purchases. Brands with strong retention can operate below their break-even ROAS on the first transaction and still build profitable customer relationships over time. But that only works if the LTV calculation is based on real historical data — not optimism.
How to Calculate Your Maximum Profitable CPA
CPA and CAC are often used interchangeably. They are not the same thing. CPA (cost per acquisition) measures what you paid per conversion — which could be a lead, a newsletter signup, or a sale. CAC (customer acquisition cost) measures what you paid per actual customer. For lead-generation businesses, the gap between the two can be enormous.
The maximum profitable CPA is the highest amount you can pay to acquire a customer before the campaign stops making money:
Max Profitable CPA = Customer Value × Gross Margin × Lead-to-Customer Rate
Example: A business sells a service for ₹50,000. The gross margin is 40%, meaning the contribution profit per customer is ₹20,000. The lead-to-customer conversion rate is 20% — one in five leads becomes a paying customer. The maximum profitable CPA (per lead) is ₹20,000 × 20% = ₹4,000. If the business is paying ₹5,000 per lead, it’s losing money on every acquisition, regardless of how many leads come in.
For lead-generation businesses, this distinction is critical. A ₹500 CPL that converts at 5% costs ₹10,000 per customer. A ₹1,500 CPL that converts at 30% costs ₹5,000 per customer. The higher CPL is the better deal. Judging lead-gen campaigns by CPL alone is one of the most common and expensive mistakes in paid search.
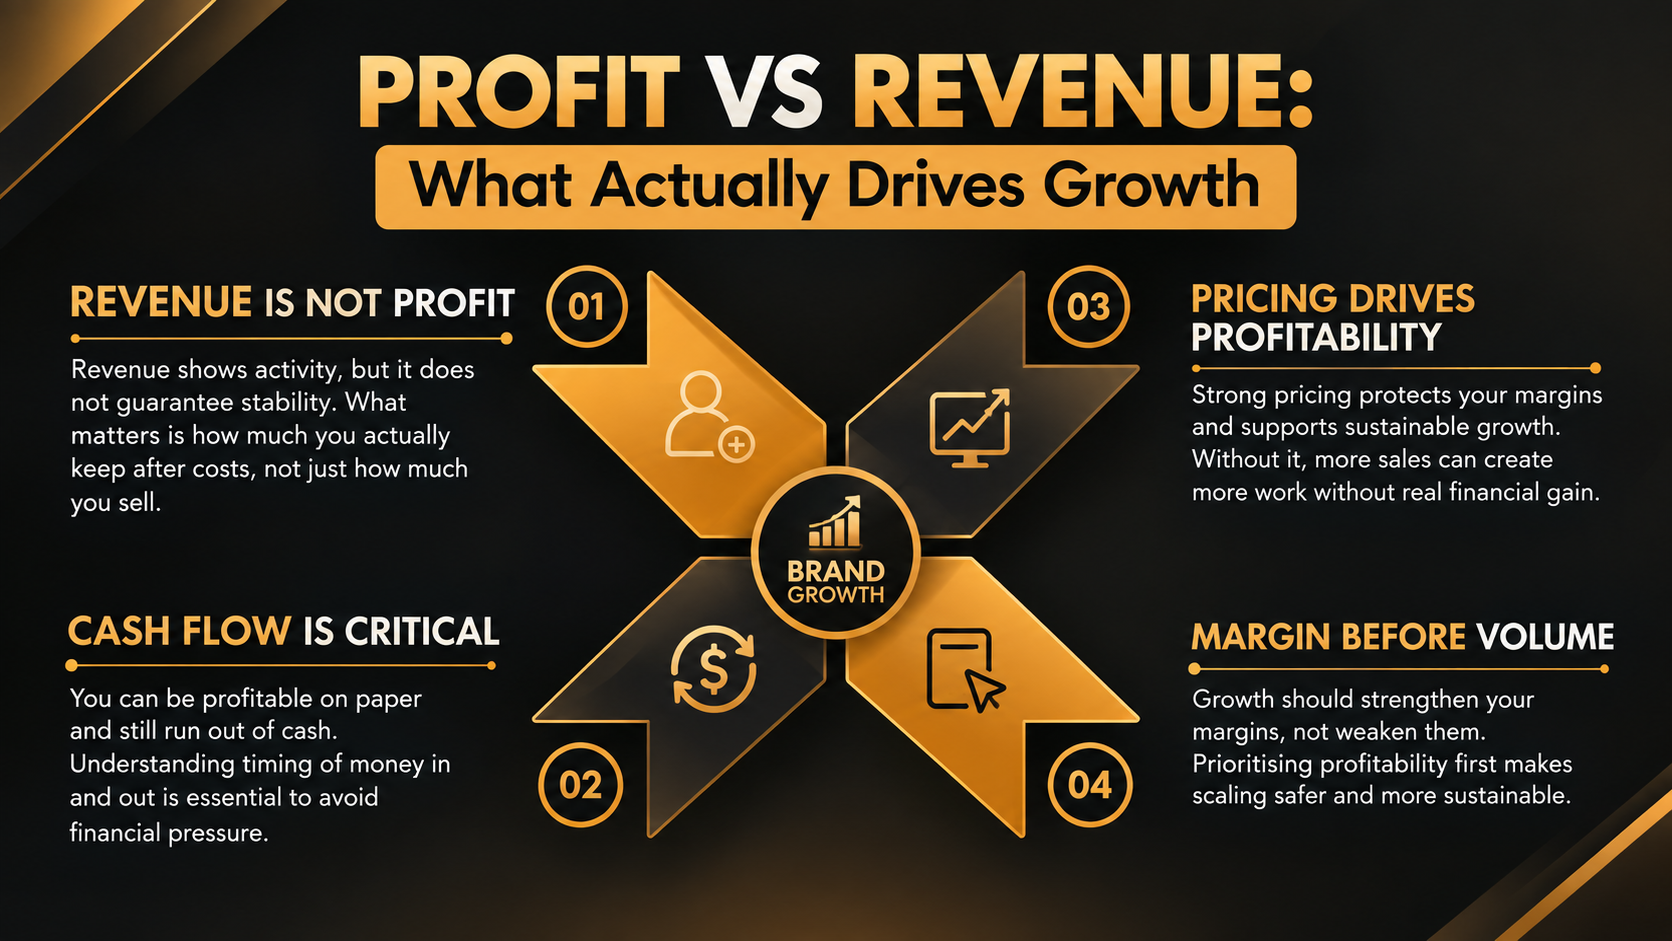
Revenue vs Profit: A Practical Example
Let’s put everything together with a realistic Indian e-commerce scenario. The numbers below are assumptions clearly labeled — your actual numbers will differ.
| Line Item | Amount (₹) | Notes |
|---|---|---|
| Google Ads Spend | 100,000 | Total campaign spend |
| Tracked Revenue | 300,000 | Conversion value reported by Google Ads |
| Number of Orders | 150 | Average order value = ₹2,000 |
| COGS (55% of revenue) | 165,000 | Product cost + shipping + packaging |
| Gross Profit | 135,000 | Revenue − COGS |
| Payment Processing (2%) | 6,000 | Gateway fees on ₹300,000 |
| Refunds (5% of revenue) | 15,000 | Returned orders and chargebacks |
| Ad Spend | 100,000 | Paid to Google |
| Contribution Profit | 14,000 | Gross profit − processing − refunds − ad spend |
| Contribution Margin | 4.7% | Contribution profit ÷ revenue |
At first glance, the campaign looks like a winner. ₹300,000 in revenue from ₹100,000 in spend is a 3× ROAS. But after accounting for product costs, payment processing, and refunds, the actual contribution profit is ₹14,000 — a razor-thin 4.7% margin. If the refund rate is higher, or if agency fees are added, the campaign tips into negative territory.
The campaign is technically profitable. But is it sustainably profitable? A 4.7% contribution margin leaves almost no room for error. A small increase in CPC, a dip in conversion rate, or a spike in returns would erase the profit entirely.
Metrics That Matter Beyond ROAS
ROAS is not useless. It’s just not sufficient. The metrics below fill the gaps that ROAS leaves open. They matter at different stages of the funnel and for different business models.
| Metric | Formula / Meaning | When It Matters Most |
|---|---|---|
| Conversion Rate | Conversions ÷ Clicks | Early funnel — tells you if traffic is relevant |
| CPA | Ad Spend ÷ Conversions | Mid-funnel — efficiency of conversion actions |
| CAC | Total Acquisition Cost ÷ New Customers | Mid-to-late funnel — true cost of acquiring a customer |
| AOV | Revenue ÷ Number of Orders | E-commerce — impacts break-even calculations |
| Gross Margin | (Revenue − COGS) ÷ Revenue | Always — the foundation of profitability |
| Profit per Customer | (Revenue × Margin) − CAC | Late funnel — the actual economics of acquisition |
| Lead-to-Customer Rate | Customers ÷ Leads | Lead gen — bridges the gap between CPL and CAC |
| Customer LTV | Average Revenue per Customer × Retention | Subscription and repeat-purchase businesses |
| Impression Share | Impressions ÷ Eligible Impressions | Awareness — how much of the market you’re capturing |
| Search Query Insights | Actual search terms triggering ads | Optimization — reveals wasted spend and intent mismatches |
Google’s own reporting has evolved to support profit-based measurement. The Google Ads API now exposes gross profit and gross profit margin metrics for advertisers who report conversions with cart data, acknowledging that revenue alone is an incomplete measure of campaign success. Advertisers can provide a cost_of_goods_sold feed attribute to see these metrics in their reporting, though Google notes that the metrics only include products with a COGS value in Merchant Center.
How Tracking Problems Can Make a Profitable Campaign Look Unprofitable — or Vice Versa
Every profitability calculation depends on accurate measurement. If the data feeding the formula is wrong, the conclusion will be wrong — sometimes dangerously so.
| Mistake | Why It Causes Problems | What to Check |
|---|---|---|
| Incorrect conversion setup | Misreported conversions inflate or deflate CPA | Verify conversion actions fire on the correct pages |
| Duplicate conversions | CPA looks better than reality | Check for multiple tags firing on the same event |
| Missing conversions | A profitable campaign looks unprofitable | Test conversion tracking in Google Tag Assistant |
| Poor attribution | Credit is misallocated across channels | Review attribution model — data-driven is the default |
| Imported conversion issues | Offline or CRM data doesn’t sync correctly | Validate import schedules and data formatting |
| Offline conversion gaps | Phone and in-person sales are invisible | Set up offline conversion imports via Data Manager API |
| Revenue values not passed | Conversion value is missing or incorrect | Check that dynamic values are configured correctly |
| Lead quality not measured | Low-quality leads look like good conversions | Feed CRM stages back as offline conversions |
| Refunds not reflected | Revenue overstates actual collected amount | Adjust for refunds in profitability calculations |
Google has made significant changes to conversion tracking in 2026. Starting in April 2026, Google Ads simultaneously accepts user-provided data from website tags, Data Manager, and API connections. And as of June 2026, enhanced conversions for web and enhanced conversions for leads have been combined into a single feature with a simple on/off switch. Advertisers who relied on legacy setups need to verify their tracking is still capturing data correctly.
Attribution has also shifted. Data-driven attribution (DDA) is now the default model for new conversion actions, replacing last-click attribution. Google deprecated four rules-based models — first click, linear, time decay, and position-based — leaving only two: data-driven and last-click. DDA uses machine learning to distribute conversion credit across touchpoints based on actual contribution, rather than applying a fixed rule.
The practical implication: if your attribution model doesn’t reflect how customers actually move through your funnel, your profitability calculations will be built on sand. A campaign that looks like a top performer under last-click may be subsidizing conversions that actually originated elsewhere.
Why Lead Generation Campaigns Require a Different Profitability Calculation
E-commerce profitability is relatively straightforward: customer clicks, buys, you calculate margin. Lead generation is messier because the conversion event — the lead — is not the revenue event. The full chain looks like this:
Ad Spend → Leads → Qualified Leads → Sales Opportunities → Customers → Revenue → Profit
Example: A B2B services company spends ₹200,000 on Google Ads and generates 400 leads at a CPL of ₹500. That sounds efficient. But only 40% of leads qualify (160 qualified leads), 25% of those become opportunities (40 opportunities), and 50% of opportunities close as customers (20 customers). The actual CAC is ₹200,000 ÷ 20 = ₹10,000 per customer. If the average customer value is ₹25,000 with a 40% gross margin, the contribution profit per customer is ₹10,000. The campaign breaks even — barely.
A ₹500 CPL looked great. The ₹10,000 CAC tells the real story. And if the close rate drops to 30%, the CAC climbs to ₹16,667, pushing the campaign into loss territory.
Google’s tools support this deeper measurement. The Google Ads API now includes nine new lead generation conversion types across three platforms and three funnel stages, allowing advertisers to track leads from initial interest through qualification to close. Advertisers can also use Customer Match lists — even 500 quality email addresses give Google enough pattern recognition to find similar high-value audiences.

How Customer Lifetime Value Changes the Profitability Picture
A customer who buys once is not the same as a customer who buys five times. If your break-even ROAS calculation assumes a single purchase, you may be undervaluing campaigns that acquire customers with strong repeat purchase behavior.
Consider a subscription business with a 12-month average retention period. If the monthly contribution profit per customer is ₹500, the LTV is ₹6,000. That means the business can afford a first-purchase CAC of up to ₹6,000 and still break even over the customer’s lifetime. A campaign that looks unprofitable on a first-order basis may be building a profitable customer base over time.
Google has built lifecycle optimization into its platform. Customer lifecycle goals allow advertisers to optimize campaigns not just for conversions, but for customer loyalty and lifetime value. The platform supports high-value customer bidding and retention targeting within the customer acquisition goals framework.
But LTV is not a blank check. It should be based on historical data, not optimistic projections. Businesses that use inflated LTV estimates to justify inefficient acquisition costs eventually discover that their actual retention rates don’t match the spreadsheet. The LTV:CAC ratio should be at least 3:1 for a healthy business — meaning the lifetime value is three times the acquisition cost. That gives enough margin to cover overhead and generate actual profit.
Common Mistakes Businesses Make When Measuring Google Ads Profitability
These mistakes appear repeatedly across e-commerce, lead generation, SaaS, and service businesses. Each one can turn a profitable campaign into a money pit — or hide profitability that’s actually there.
- Looking only at ROAS. ROAS is revenue efficiency, not profitability. A 5× ROAS on a 15% margin product loses money. A 2× ROAS on a 60% margin product makes money.
- Treating revenue as profit. Revenue is what customers pay. Profit is what remains after COGS, fulfillment, fees, refunds, and ad spend. They are not the same number.
- Ignoring margins. A campaign that works for a luxury brand with 70% margins will fail for a dropshipper with 20% margins on the same CPCs and conversion rates.
- Ignoring refunds and cancellations. A 10% refund rate on ₹300,000 in revenue removes ₹30,000 from the top line. If the campaign was running at break-even, refunds push it into loss.
- Measuring leads instead of customers. CPL is a vanity metric if only 5% of leads become customers. What matters is the cost per customer, not the cost per lead.
- Using incorrect conversion values. If dynamic revenue values aren’t configured, Google reports the same static value for every conversion. A ₹500 sale and a ₹50,000 sale look identical.
- Ignoring offline sales. Phone orders, in-store purchases, and sales closed in CRM after the ad click often don’t appear in Google Ads reporting, making the campaign look less effective than it is.
- Ignoring repeat purchases. A customer acquired at a loss on the first transaction may be profitable over time. But if the business doesn’t track repeat purchases, it can’t see the full picture.
- Comparing campaigns with different economics. A brand campaign targeting existing customers and a prospecting campaign targeting new audiences have different CPA thresholds. Judging them by the same ROAS target is unfair and inaccurate.
- Making decisions from too little data. A campaign that has 5 conversions cannot be reliably judged as profitable or unprofitable. Smart Bidding strategies like Target ROAS need 30-50 conversions per month to function effectively.
A Simple Google Ads Profitability Framework
This is a repeatable process you can apply to any Google Ads account, regardless of business model. Work through it sequentially — each step builds on the last.
- Step 1: Calculate total advertising spend. Pull the exact amount spent on Google Ads for the period you’re analyzing. Include management fees or agency costs if applicable.
- Step 2: Measure tracked revenue or customer value. Use conversion value from Google Ads, but verify that dynamic values are configured correctly. If not, use your CRM or e-commerce platform data.
- Step 3: Determine gross or contribution margin. Subtract COGS, fulfillment, shipping, and payment processing from revenue. This is the margin you have available to cover ad costs.
- Step 4: Calculate acquisition cost. Divide ad spend by the number of new customers acquired. For lead gen, account for lead-to-customer conversion rates.
- Step 5: Account for refunds, cancellations, and relevant variable costs. Apply your historical refund rate to revenue. Subtract any other variable costs directly tied to the campaign.
- Step 6: Calculate contribution profit. (Revenue × Margin) − Ad Spend − Other Variable Costs = Contribution Profit.
- Step 7: Compare actual results with break-even targets. Calculate your break-even ROAS (1 ÷ Margin) and compare it to actual ROAS. Also compare actual CPA to maximum profitable CPA.
- Step 8: Evaluate customer lifetime value when appropriate. If the business has repeat purchases or subscriptions, calculate LTV from historical data and factor it into the acquisition cost ceiling.
- Step 9: Check tracking accuracy. Verify conversion actions, attribution models, and offline conversion imports. Inaccurate data invalidates every calculation above.
- Step 10: Make optimization decisions based on business profit, not vanity metrics. Use the contribution profit number as your primary decision-making metric. Scale what works. Fix what’s close. Pause what doesn’t.
How to Improve Google Ads Profitability
These are not generic tips. Each one directly affects one of the variables in the profitability equation.
- Improve conversion tracking. Accurate data is the foundation. If Google doesn’t see the true value of a conversion, Smart Bidding optimizes toward the wrong outcome.
- Improve landing pages. A higher conversion rate reduces CPA without changing bid strategy. The same traffic converts more, lowering acquisition costs.
- Improve conversion quality. Feed CRM stages back as offline conversions. Google’s API now supports nine lead gen conversion types across funnel stages, allowing Smart Bidding to optimize for qualified leads rather than raw form fills.
- Refine targeting. Review search query reports for irrelevant terms. Add negative keywords. Exclude audiences that never convert. Wasted spend is the fastest path to unprofitability.
- Improve ad-to-landing-page alignment. When the ad promise matches the landing page offer, conversion rates rise. When they don’t, bounce rates rise and CPA climbs.
- Improve offer positioning. A stronger offer — free trial, bundled value, risk reversal — increases conversion rates without increasing ad spend.
- Reduce wasted spend. The average Google Ads account wastes $1,127 per month, with 29% recording zero conversions. Negative keywords alone can triple conversion rates.
- Improve lead qualification. For lead gen, use form fields, qualifying questions, and offline conversion imports to separate high-intent leads from tire-kickers.
- Improve customer value. Increase AOV through upsells, cross-sells, and bundles. A higher AOV improves the economics of every acquired customer.
- Test bidding strategies carefully. Target ROAS and Target CPA need 30-50 conversions per month to function effectively. Setting tROAS without real margin modeling behind it causes Google to spend into thinner profitability bands.
- Use accurate conversion values. Pass dynamic revenue values for every conversion. This lets Smart Bidding optimize toward high-value customers rather than just conversion volume.
- Analyze profitability by campaign, product, or service. A blended ROAS can hide the fact that one product category is highly profitable while another is bleeding money.
- Separate acquisition goals from retention economics. New customer acquisition and repeat purchase campaigns have different CPA thresholds. Don’t judge them by the same metric.
The Bottom Line
A Google Ads campaign should not be judged by how many clicks, conversions, or rupees of revenue it generates. The only question that matters is whether the customers acquired through advertising create enough economic value to justify the total cost of acquiring them.
That means calculating contribution profit, not just ROAS. It means knowing your break-even point and your maximum profitable CPA. It means accounting for refunds, fees, and the difference between a lead and a customer.
The businesses that win with Google Ads long-term are not the ones with the highest ROAS. They’re the ones that understand their unit economics so well that they can confidently scale profitable campaigns and cut unprofitable ones before they drain the bank account.
Ready to See What Your Google Ads Campaigns Are Actually Earning?
Mediazaar helps businesses evaluate Google Ads performance through the lens of business goals, conversion quality, acquisition costs, and actual profitability — not just dashboard metrics.
A Google Ads campaign is profitable when the revenue or profit generated from conversions is greater than the total cost of acquiring those customers through advertising.
No. ROAS measures revenue generated compared with ad spend, but it does not account for product costs, operating expenses, discounts, refunds, or other costs. Profitability requires looking beyond ROAS.
Yes. A higher CPA can be acceptable when customers have high order values, strong profit margins, repeat purchases, or significant lifetime value.
Whenever possible, measure profit or contribution margin in addition to revenue. Revenue tells you what you generated; profit tells you what you actually kept after relevant costs.
Not necessarily. Some campaigns are designed to generate leads, build customer relationships, or acquire customers whose value appears later. However, you should still establish financial targets and understand how the campaign contributes to business growth.
Instead of asking only “How much revenue did my ads generate?”, ask “How much profitable business did my ads generate after the costs required to acquire and serve those customers?” That shift can lead to much better advertising decisions.