
Beyond Open Rates: The Email Marketing Metrics That Actually Matter in 2026
An email being opened does not necessarily mean that it influenced a customer, generated a lead, produced a sale, or created business value. Modern email measurement should move from “Did someone open the email?” to “What happened because we sent the email?”
Are Open Rates Still Relevant in 2026?
Open rate measures the percentage of delivered emails that were opened. Historically, marketers relied on it because it was the first meaningful signal available in most email platforms, and it offered a quick read on subject lines and sender recognition. It can still be useful as a directional diagnostic metric—especially when you compare your own campaigns over time.
But Apple Mail Privacy Protection has structurally inflated open rates since 2021. Apple Mail pre-fetches tracking pixels the moment an email lands, before a human has seen the subject line. Apple Mail accounts for roughly 47% of all email opens as of January 2026, based on 1.1 billion tracked opens. A campaign reporting a 50% open rate post-MPP might genuinely have a 25–30% human open rate.
The distinction that matters: Open rate is a useful diagnostic metric for subject-line testing and send-time optimization. It is not a business outcome metric. It does not tell you whether anyone engaged with your content, clicked through, or converted.
The Problem With Measuring Email Success by Opens Alone
A high open rate does not automatically mean high engagement, more clicks, more leads, more sales, higher revenue, or better customer retention. It means a tracking pixel loaded. That is it.
Consider two hypothetical campaigns:
- Campaign A: 50% open rate, 2% click rate, 0.3% conversion rate
- Campaign B: 35% open rate, 8% click rate, 4% conversion rate
Campaign B may be significantly more valuable despite having a lower open rate. The people who did open were far more likely to engage, click, and convert. If those conversions are purchases, Campaign B could generate several times the revenue of Campaign A from the same list size.
This is why the question needs to shift from “How many people opened?” to “What did they do next?”
The Email Marketing Metrics That Actually Matter in 2026
1. Click-Through Rate (CTR)
Formula: CTR = (Total Clicks ÷ Delivered Emails) × 100
CTR tells you what percentage of people who received the email actually clicked a link inside it. Unlike open rate, a click requires a deliberate human action. Someone had to read enough of the email to decide a link was worth their time. That decision carries far more weight than a tracking pixel loading automatically.
In 2026, Klaviyo’s benchmark data shows a good email click rate is 1.69% for campaigns and 5.58% for flows. The gap between campaigns and flows is significant—it reflects the difference between sending to a broad list and sending to people based on a specific action or trigger they just took.
Limitations: CTR can be inflated by bot clicks in some environments, and it does not tell you whether the click led to a meaningful action. Pair it with conversion data.
2. Click-to-Open Rate (CTOR)
Formula: CTOR = (Unique Clicks ÷ Unique Opens) × 100
CTOR measures how effective your email content is at getting people who opened to click. It isolates the quality of your body copy, call-to-action, and offer from the subject line’s performance.
MailerLite data suggests a good email click-to-open rate is 6.81%, meaning just under 7 in every 100 people who open go on to click a link inside. The GDMA Email Benchmark 2026 puts CTOR at 7.7%.
Important caveat: Because CTOR uses opens in the denominator, it inherits the reliability problems of open tracking. If Apple MPP is inflating your open count, your CTOR will look artificially low. Use it as a relative comparison between your own campaigns, not as an absolute benchmark.
3. Conversion Rate
Formula: Conversion Rate = (Conversions ÷ Delivered Emails or Clicks) × 100
A conversion is whatever action you defined as valuable: a purchase, a form submission, a demo booking, a registration, a download. The denominator matters—conversions per delivered email tells a different story than conversions per click.
In 2026, email marketing conversion rates typically range from 1–5% across most industries, with rates above 3% considered good performance. Automated flows convert at 2.11% versus 0.16% for campaigns—a 13x advantage.
Conversion rate is often more meaningful than open rate because it connects email activity to a tangible outcome. But it still does not tell you the value of that outcome. A 4% conversion rate on a $10 product is a very different business result than a 4% conversion rate on a $2,000 service.
4. Revenue Per Email
Revenue per email divides the total revenue attributed to a campaign by the number of emails delivered. It gives you a direct monetary read on campaign efficiency.
Example: A promotional campaign delivers 10,000 emails and generates $2,500 in revenue. Revenue per email = $0.25. If a product launch campaign delivers the same 10,000 emails and generates $8,000, revenue per email = $0.80. The second campaign is more than three times as efficient per send.
Klaviyo’s 2026 benchmarks show top 10% email flows achieve revenue per recipient as high as $7.79, while average campaigns generate far less. This metric is especially useful for comparing campaigns of different sizes and identifying which offers, audiences, and send times produce the most value per contact.
5. Email Marketing ROI
Formula: ROI = ((Revenue − Marketing Cost) ÷ Marketing Cost) × 100
Revenue is not the same as profit. Profit is not the same as ROI. ROI accounts for the cost of generating that revenue—platform fees, design costs, copywriting, list acquisition, and the labor involved in running the program.
Sinch Mailgun’s 2026 Email Impact Report found that fewer than half of senders actively measure the ROI of their email programs. Among those who do measure promotional email ROI, 60% report returns greater than $10 for every $1 spent, and 13% report returns above $40:1. Omnisend puts the industry average at $36–$42 for every dollar spent.
A campaign that generates $50,000 in revenue but costs $45,000 to run is not a success. A campaign that generates $15,000 in revenue but costs $2,000 is. ROI forces you to look at both sides of the equation.

6. Click-to-Conversion Rate
This metric answers the question: once someone clicks, what percentage of them actually convert?
The journey is: Email → Click → Landing Page → Action → Conversion. If clicks are high but conversions are low, the problem is almost never the email. It is the landing page, the offer, the user experience, the message alignment, or the checkout process.
Tracking click-to-conversion rate helps you isolate where the funnel is leaking. It separates email performance from post-click performance, which is essential for making the right fixes.
7. Unsubscribe Rate
Unsubscribe rate measures the percentage of recipients who opted out of future emails. A rising unsubscribe rate is not necessarily a bad thing—it can mean you are finally sending to people who were never going to engage and are now cleaning your list for you. It can also mean your frequency, relevance, segmentation, or content quality needs work.
Sinch Mailgun’s analysis of 172.9 billion sends found that Information Technology logged 261 million unsubscribes—the highest raw number—but that was only roughly 0.15% across those sends. Retail generated 37.4 million unsubscribes on just 8.08 billion sends, a far higher rate per email. Raw unsubscribe volume without send volume context is meaningless.
A healthy unsubscribe rate is generally under 0.5%. If yours is climbing, ask subscribers why. Sometimes a simple preference center—letting people choose frequency or content type—retains people who would otherwise leave entirely.
8. Bounce Rate
Hard bounces are permanent failures—invalid addresses, non-existent domains. Soft bounces are temporary—full inboxes, server issues. Both matter, but hard bounces are a list hygiene signal.
A healthy bounce rate is under 2%. Crossing 5% is where mailbox providers start treating you as a sender worth watching closely. High bounce rates damage sender reputation, and sender reputation determines whether your emails reach the inbox at all.
9. Spam Complaint Rate
Google and Yahoo now enforce a spam complaint rate threshold of 0.3% for bulk senders, with Google recommending staying below 0.1%. Exceed that threshold and your emails get filtered, throttled, or rejected.
Spam complaints are rarely about one bad email. They are usually a signal that people do not remember signing up, do not recognize your sender name, or feel you are sending too often with too little value. Permission, relevance, frequency, and sender identity all feed into this metric.
10. List Growth Rate
Formula: List Growth Rate = ((New Subscribers − Unsubscribes − Invalid Contacts) ÷ Starting List Size) × 100
Growing the email database matters because your list is an owned asset. Unlike social followers or search traffic, your email list is not subject to algorithm changes or platform policy shifts. A healthy list growth rate means you are acquiring new contacts faster than you are losing them.
But sustainable list growth is not just about volume. A list that grows 20% per year with low engagement is less valuable than a list that grows 5% with high engagement. Quality compounds; quantity without quality just creates deliverability problems.
11. Engagement Rate
Engagement rate is a broader measure of meaningful interaction. It can include clicks, replies, website visits, conversions, and repeat engagement over time. The definition depends on what matters for your business model.
For B2B, replies are often the strongest engagement signal. For e-commerce, repeat site visits and product views after an email send indicate genuine interest. The key is to move beyond opens and define engagement in terms of actions that correlate with your business outcomes.
12. Customer Lifetime Value (CLV/LTV)
CLV is the total revenue you expect from a customer over the entire relationship. Email marketing should not always be judged on one campaign’s immediate revenue. A welcome email that generates a $20 first purchase might seem modest—until you account for the fact that customer goes on to spend $400 over two years.
The journey is: First Purchase → Repeat Purchase → Retention → Customer Lifetime Value. Email is one of the few channels that can follow a customer through that entire lifecycle. Dotdigital notes that reducing monthly churn by even 1 percentage point can increase LTV by 20–50%.
13. Revenue Per Subscriber
Revenue per subscriber divides total email-attributed revenue by the number of active subscribers. It tells you the economic value of your email database. A smaller list of highly engaged subscribers can often generate more revenue per person than a much larger list of passive contacts.
This metric is useful for deciding whether to invest in list growth or list quality. If revenue per subscriber is low, adding more subscribers may not help much. If it is high, you have a strong case for investing in acquisition.
14. Deliverability and Inbox Placement
An email cannot generate results if it does not reach the inbox. Deliverability is the foundation on which every other metric rests.
Delivery rate measures whether the receiving server accepted your email. Inbox placement measures whether it landed in the inbox versus the spam folder. A 98% delivery rate means very little if half those emails went to spam.
Google and Yahoo now require SPF or DKIM authentication for all senders, DMARC for bulk senders, one-click unsubscribe for promotional mail, and unsubscribes honored within two days. These are not optional recommendations. They are compliance requirements. Sender reputation is built on authentication, engagement, low complaint rates, and consistent sending patterns.
Email Metrics by Business Goal
| Business Goal | Metrics to Track |
|---|---|
| Build awareness | Reach, engagement, clicks |
| Generate leads | CTR, landing-page conversion rate, leads |
| Drive sales | Conversion rate, revenue, ROI |
| Increase retention | Repeat purchase rate, LTV |
| Improve deliverability | Bounce rate, spam complaints, inbox placement |
| Grow the database | List growth rate, subscriber quality |
| Improve content | CTR, CTOR, replies, conversions |
Which Email Metrics Should E-commerce Businesses Track?
E-commerce email programs live and die by revenue metrics. The most important ones are:
- Revenue per email — how much each send generates
- Conversion rate — what percentage of recipients purchase
- Average order value (AOV) — the typical spend per order, and whether email is influencing larger baskets
- Repeat purchase rate — how many customers come back
- Customer lifetime value — the long-term value of email-acquired customers
- Cart recovery performance — revenue recovered from abandoned carts
- Product click rate — which products get the most attention
- Unsubscribe rate — a signal of list fatigue
Example: An e-commerce brand sends a browse abandonment email to 5,000 people. It generates 120 clicks, 18 orders, and $2,340 in revenue. Revenue per email = $0.47. If the same brand sends a promotional campaign to its full 50,000-person list and generates $8,000, revenue per email = $0.16. The browse abandonment flow is nearly three times as efficient per send. Klaviyo’s 2026 data confirms this pattern: flows generate nearly 41% of total email revenue from just 5.3% of sends.
Which Metrics Should B2B Businesses Track?
B2B email has a longer sales cycle. Clicks are useful, but they are not the outcome. The metrics that matter are:
- Lead conversion rate — email-to-lead percentage
- Demo bookings — the primary conversion action for many B2B companies
- Marketing-qualified leads (MQLs) — leads that meet engagement and fit criteria
- Sales-qualified leads (SQLs) — leads ready for a sales conversation
- Pipeline contribution — email’s role in creating sales opportunities
- Cost per lead — the efficiency of email in generating leads compared to other channels
- Revenue influenced — deals where email touched the buyer at any stage
- Lead-to-customer conversion — the full journey from email engagement to closed deal
B2B open rates now sit near a ~40% average with ~3% click-through rate, but these numbers are less important than the pipeline they create. B2B marketers should not judge success only by clicks. A single demo booked from an email that 500 people received might be worth more than 50 clicks that never turn into conversations.
How AI Is Changing Email Marketing Measurement in 2026
AI is shifting email measurement from retrospective reporting to predictive decision-making. Instead of looking at last week’s numbers and guessing what to do next, AI systems can surface patterns in real time and recommend actions.
What AI can genuinely help with:
- Predict engagement — which subscribers are likely to click or convert
- Segment audiences — dynamic segments based on behavior, not static lists
- Personalize campaigns — product recommendations and content based on first-party and zero-party data
- Identify high-value customers — those most likely to generate long-term revenue
- Detect churn signals — disengagement patterns before someone unsubscribes
- Optimize send times — per-subscriber timing based on past behavior
- Predict conversion likelihood — scoring recipients before the send
But AI is only as good as the data it works with. Poor data quality, inconsistent CRM records, and unhygienic lists will produce poor predictions. Human oversight is also essential. AI can recommend, but a marketer should decide. Privacy and responsible personalization are not optional—they are the foundation of trust that makes email work at all.
From Email Metrics to the Customer Journey
Every email sits somewhere in a customer journey. The metrics that matter change at each stage:
Delivered → Delivery rate, bounce rate. Did the email reach the inbox?
Engaged → Open rate (with caveats), CTR. Did anyone show initial interest?
Clicked → CTR, CTOR. Did interest translate into action?
Visited → Landing page visits, time on page, pages per session. What happened after the click?
Converted → Conversion rate, cost per acquisition. Did the visit produce a desired action?
Purchased → Revenue per email, AOV. What was the monetary value of the conversion?
Returned → Repeat purchase rate. Did the customer come back?
Became Loyal → LTV, retention rate, advocacy. What is the long-term value of the relationship?
Measuring at each stage helps you identify exactly where the journey breaks down. A high click rate but low conversion rate is a landing page problem. A high conversion rate but low repeat rate is a post-purchase experience problem. High engagement but low revenue is an offer or pricing problem.
The Email Marketing Metrics Dashboard Every Business Should Have
A good dashboard is not the one with the most numbers. It is the one that helps you make better decisions. Here is a practical structure:
Engagement: CTR, CTOR, replies, engagement rate
Conversion: Conversion rate, leads, purchases, demo bookings
Revenue: Revenue per email, revenue per subscriber, ROI, customer lifetime value
List Health: Bounce rate, unsubscribe rate, spam complaint rate, list growth rate
Deliverability: Delivery rate, inbox placement, sender reputation indicators
Monitoring cadence:
- Daily: Deliverability alerts, spam complaint spikes, bounce spikes
- Weekly: Campaign CTR, conversion rate, revenue per email, unsubscribe rate
- Monthly: ROI, list growth rate, revenue per subscriber, LTV trends
- Quarterly: Customer lifetime value by cohort, deliverability audits, competitive benchmarking
Industry benchmarks vary widely by sector and list composition. Validity’s 2026 benchmark puts the global inbox placement rate at 83.5%, with 6.7% of emails going to spam and another 9.8% not reaching the inbox at all. Use benchmarks as directional guides, not absolute targets. Your own historical performance is the most meaningful comparison.
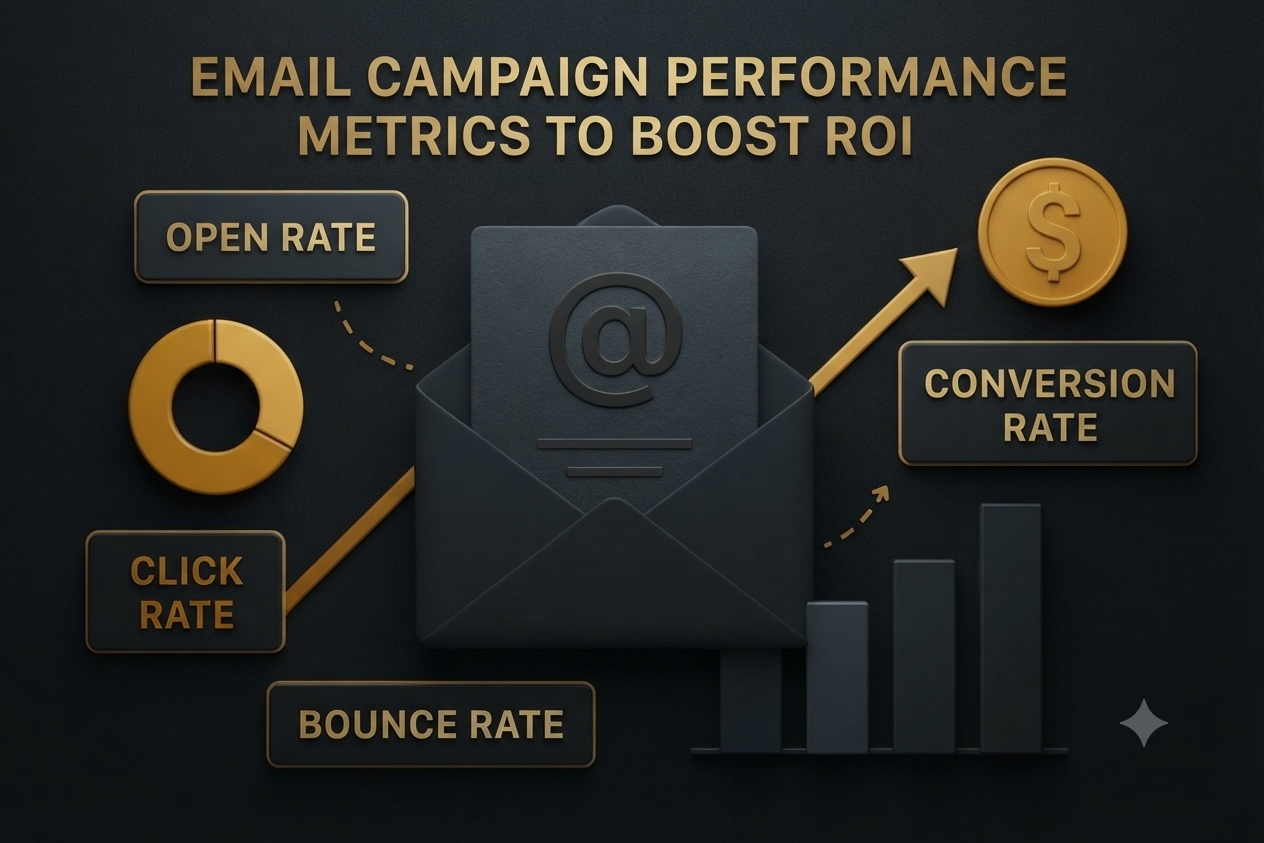
How to Know Which Email Metrics Matter Most
There is no universal list of “best” email marketing metrics. The right metrics depend on your business model, campaign objective, customer journey, sales cycle, audience, conversion action, and revenue model.
Simple framework: Goal → Metric → Benchmark → Action
Example:
- Goal: Generate leads
- Metric: Lead conversion rate
- Problem: Low conversion
- Action: Improve offer, landing page, or targeting
The framework forces you to connect measurement to action. A metric you cannot act on is a metric you do not need on your dashboard.
Common Email Marketing Measurement Mistakes
- Obsessing over open rates — they are structurally inflated and do not measure human behavior.
- Tracking too many metrics — a dashboard with 30 numbers helps no one make a decision.
- Ignoring conversions — clicks without conversions are interesting, not valuable.
- Ignoring revenue — engagement metrics matter, but revenue pays the bills.
- Measuring clicks without downstream behavior — what happens after the click is often where the real story is.
- Ignoring deliverability — if emails are not reaching the inbox, no other metric matters.
- Comparing unrelated campaigns — a welcome email and a promotional blast are not the same thing.
- Using the wrong denominator — conversions per delivered email and conversions per click tell different stories.
- Ignoring customer lifetime value — judging email on one campaign’s revenue misses the long game.
- Failing to connect email analytics with CRM and website data — siloed data produces incomplete insights.
- Treating vanity metrics as business outcomes — a high open rate is not a business outcome.
- Making decisions from one campaign only — one data point is an anecdote, not a trend.
A Practical 2026 Email Marketing Measurement Framework
Step 1: Define the campaign goal. Is this email meant to generate leads, drive sales, re-engage, or retain? The goal determines the primary metric.
Step 2: Choose one primary KPI. One. Not five. A campaign with five primary metrics has none.
Step 3: Select supporting metrics. These provide context. If the primary KPI is conversion rate, supporting metrics might include CTR, landing page conversion rate, and revenue per email.
Step 4: Track downstream actions. Follow the journey past the click. What happens on the landing page? What happens in the CRM?
Step 5: Connect email data with website and CRM data. UTM parameters, CRM integration, and first-party data collection are the infrastructure that makes meaningful measurement possible.
Step 6: Measure revenue or business value. If email cannot be connected to revenue or a defined business outcome, it is a cost center, not a growth channel.
Step 7: Compare against meaningful benchmarks. Your own historical performance first, industry benchmarks second.
Step 8: Identify the problem. Where is the journey breaking down? Is it the email, the click, the landing page, the offer, or the checkout?
Step 9: Test one variable. Subject line, send time, offer, CTA, landing page. One change at a time.
Step 10: Improve the next campaign. Measurement without action is just reporting. The point is to make the next send better than the last.
Example: Two Email Campaigns, Two Very Different Results
The following numbers are hypothetical and used for illustration.
Campaign A
Open rate: 48%
Click rate: 1.8%
Conversion rate: 0.2%
Revenue: $1,200
Campaign B
Open rate: 32%
Click rate: 7.2%
Conversion rate: 3.5%
Revenue: $14,800
Campaign A looks better on the surface. A 48% open rate feels like success. But the people who opened did not click. They did not convert. They did not generate meaningful revenue.
Campaign B has a lower open rate, but the people who did open were far more engaged. They clicked, they converted, and they generated more than 12 times the revenue. If the goal was sales—and for most businesses, it is—Campaign B is the clear winner.
This is not a hypothetical edge case. It is the pattern that emerges when you measure downstream behavior instead of stopping at the open.
What Should You Stop Measuring—and What Should You Start Measuring?
| Instead of Focusing Only On | Start Paying More Attention To |
|---|---|
| Open rate | Clicks and meaningful engagement |
| Email opens | Conversions |
| Subscriber count | Subscriber quality |
| Revenue alone | Profit and ROI |
| One campaign | Long-term customer value |
| Delivery | Inbox placement and engagement |
The Future of Email Marketing Measurement
Measurement is moving from channel-level reporting to customer-level measurement. Instead of asking “how did this email perform?”, the question becomes “how did email contribute to this customer’s journey?”
The trends shaping this shift:
- First-party data — as third-party cookies disappear, owned data becomes the foundation of measurement
- AI-assisted analytics — predictive models that identify patterns humans would miss
- Cross-channel attribution — understanding how email interacts with paid, social, and organic
- Revenue-based reporting — moving from engagement metrics to business outcome metrics
- Privacy-aware measurement — respecting user consent while still extracting meaningful signals
- Lifecycle marketing — measuring email’s contribution across the full customer relationship
- Real-time personalization — content and offers that adapt based on behavior, not static segments
- Customer lifetime value — the ultimate metric for measuring whether email is building long-term relationships
The direction is clear: email measurement is becoming less about what happened in the inbox and more about what happened to the business because of what happened in the inbox.
Conclusion
Open rates can provide context. They should not define success. In 2026, the email marketing metrics that matter are the ones that connect engagement to behavior, behavior to conversion, conversion to revenue, and revenue to customer value.
The question is no longer “How many people opened our email?” It is “What business outcome did this email create?” The best email dashboard is not the one with the most numbers. It is the one that helps you make better decisions about what to send, who to send it to, and what to do next.
Measure what matters. Then act on it.
The most valuable metrics include click-through rate (CTR), click-to-open rate (CTOR), conversion rate, revenue per email, revenue per recipient, unsubscribe rate, bounce rate, list growth, and customer lifetime value.
Email privacy technologies can automatically load tracking pixels, creating opens that may not represent genuine human engagement. This makes open rates useful as a supporting metric rather than a standalone KPI.
Email list growth rate measures how quickly your subscriber database is increasing after accounting for new subscribers and losses such as unsubscribes and invalid addresses. Sustainable growth is more valuable than simply accumulating a large list.
Email conversion rate and qualified leads generated are useful starting points. For lead-generation campaigns, marketers should also track cost per lead, lead quality, sales-qualified leads, and ultimately revenue generated from those leads.
CLV helps determine the long-term value of customers acquired or nurtured through email. Instead of judging a campaign only by immediate purchases, marketers can evaluate whether email contributes to repeat purchases and stronger customer relationships.
Yes. Both can indicate problems with email relevance, frequency, targeting, or subscriber expectations. Tracking them together can help identify whether campaigns are creating negative audience experiences.